The ReFH Urban Model
Urban areas are a mosaic of impervious and green (pervious) spaces as shown diagrammatically in Figure 2. Impervious spaces were historically commonly positively drained by surface drains or combined sewers. Post 1950s developments are commonly served by separate foul sewers and surface water drainage. With the advent of SuDS the focus of drainage design is now to mitigate at source and/or storage of impervious runoff for subsequent release at controlled rates. Some of the green spaces historically may also run off on to drained impervious surfaces, and thus may also be positively drained.
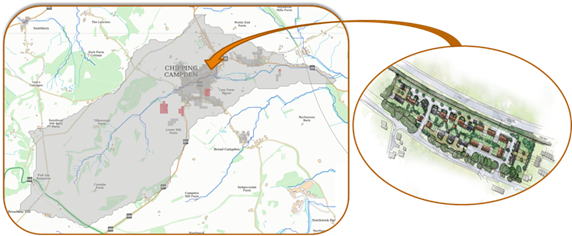
Figure 2. Urban catchments: a mosaic of green and impervious spaces.
It is generally accepted that an increase in urban extent and hence impervious area should result in decreased infiltration capacity and surface storage, thereby increasing runoff volumes. At the same time the positive drainage of the impervious surfaces and green (pervious) spaces that drain to these impervious surfaces will reduce catchment response time. The combination of these two effects will increase the peak flows experienced in urbanised catchments and the fraction of total runoff that is direct runoff.
ReFH2 models urbanised catchments as a rural area and an urban area. The urban area is modelled as an impervious extent and a pervious (green space) extent. The direct runoff from both the impervious and the pervious extents is routed through an enhanced unit hydrograph model.
ReFH2 has two implementations of the urbanisation model:
- The enhanced version of the urbanised model (implemented in ReFH2.3 and later version) that closes a water balance over the urban area, detailed in ReFH2 Science Report: Closing a Water Balance^{R2}.
- The legacy ReFH2.2 model as published by Kjeldsen et al (2013) which is not constrained to close a water balance.
The paper by Kjeldsen et al (2013), provides the full mathematical description of the basic urbanisation model and the estimation of the urban area from the URBEXT_2_0_0_0 catchment descriptor. The paper also suggests values for the other parameters used in the model however these have been superseded by further research, as will be discussed under application of the urbanised model.
The hydrograph simulated by ReFH2 is an area weighted sum of the hydrographs modelled for the rural and urban areas of the catchment. The rural part of the catchment is modelled using the Rural Model. The default ratio of the urban area to the catchment area is estimated from URBEXT_2_0_0_0 thus initial estimates of the urban catchment area and rural catchment area can be made using the ReFH XML export from the FEH Web Service.
In line with the ReFH modelling framework, the modelling of the urban area comprises the modelling of losses and generation of nett rainfall, routing of nett rainfall to direct runoff and baseflow generation from the effective pervious surface.
Urban Loss Model
The urban area is comprised of impervious areas and pervious areas. The generation of nett rainfall from the pervious areas is modelled using the rural ReFH loss model. The fraction of the urban area that is impervious is defined by the Impervious Factor, IF, parameter. The pervious fraction by inspection is therefore (1-IF).
The nett rainfall from the impervious surface is assumed to be a fraction of the rainfall incident upon the surface. This fraction, the Impervious Runoff Factor (IRF) is a model parameter.
In the original work by Kjeldsen et al (2013) it was assumed that (1-IRF) of the rainfall incident upon the catchment surface was held in storage and did not contribute to nett rainfall. IRF is typically in the order of 0.7 and thus 0.3 of the incident rainfall was held on the catchment surface. For the modelling of the QMED event this would commonly be in the order of a centimetre of water and for more extreme events larger still. This is obviously unrealistic but a modelling convenience which, as Kjeldsen et al (2013) identifies, dates back to early work on urbanised runoff of the late 1970s and 1980s.
The IRF parameter can alternatively be regarded as the fraction of the impervious surface that is positively drained where drainage is assumed to be 100% efficient. The area of impervious surface that is not positively drained is then defined by (1-IRF). Clearly there will be an element of Depression Storage, DS (mm), across this area. Rainfall in excess of this storage will contribute to the pervious runoff within the urban area through percolation through cracks or edge run off and percolation. The Nett Rainfall from the urban area within a time step is given by:
Where:
NR_{urban} = nett urban rainfall, NR_{rural}= nett rural rainfall (from the ReFH2 rural loss model), P(t) = incident precipitation; and DOF= Depression Overflow Factor
if \sum_{0}^tP(t) - DS <0, DOF(t) = 0
if \sum_{0}^tP(t)-DS >1, DOF(t)=1
if 0 < \sum_{0}^tP(t)-DS < 1 , DOF(t)=\sum_{0}^tP(t) - DS
This revised urban loss model closes a water balance and is presented schematically in Figure 3. If DOF(t) is constrained to be 0 then this loss model simplifies to the original urban loss model of Kjeldsen et al (2013). The default parameters for the water balance and legacy models are discussed in Application of ReFH2 in urbanised catchments.
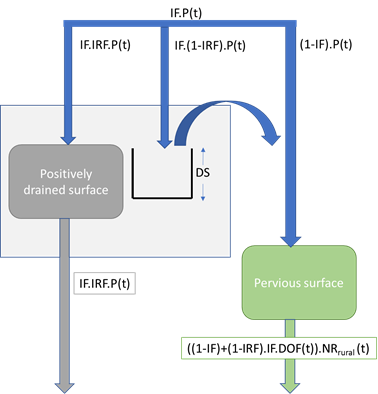
Figure 3. The ReFH2 urban area loss model closing a water balance
Routing Model
For catchment application the impact of urbanisation on the reduction in response time has been made by introducing separate unit hydrographs for routing the excess rainfall generated from the rural and urban (comprising both impervious and pervious parts of the catchments). The Tp, time to peak of the unit hydrograph, parameter value, for the urban area is expressed as a ratio of the (larger) Tp for the rural area to the urban Tp. The same basic dimensionless shape of the Unit Hydrograph has been retained as for the rural area.
Baseflow Model
In the ReFH2 model there is a direct link between the routed direct runoff and recharge through the baseflow model, i.e. an increase in routed direct runoff from the urban area would result in an axiomatic increase in baseflow. This is hydrologically counter-intuitive, hence in the original work of Kjeldsen et al (2013) the baseflow routing is modified such that the recharge is related to only the direct runoff from the rural compartment and no baseflow was generated from either the pervious areas or the impervious areas within the urban compartment. However, this prevents a water balance being closed across the urban area. It is intuitive that the pervious areas within the urban area would continue to generate baseflow, thus if the water balance option is selected the pervious areas in the urban compartment do contribute to baseflow. This baseflow is predicated on the pervious direct runoff series that would be generated if the as-rural estimate of Tp was used. If the actual runoff series using the enhanced Tp was used to generate this baseflow the baseflow would be more peaked than the baseflow generated from the rural compartment – again, counterintuitive.
Application of ReFH2 in Urbanised Catchments
Application of the model in urbanised catchments requires a choice of whether the design storm is a winter or summer storm (see Seasonal Correction Factors) and the choice of parameters for the urban area modelling. The urban modelling framework is a flexible modelling framework and the user has the opportunity to override all default decisions and parameter estimates.
Choice of Storm Seasonality
The first decision is the choice of a winter or summer storm. Catchments that are significantly urbanised are smaller catchments. The consensus is that the largest floods in these catchments are caused by intense summer convective storms with associated large runoff volumes from the impervious surfaces within the catchment.
The seasonality of the annual maximum flood has been re-visited as part of recent research (see Small Catchments Project Phase 2 Report 6). Using circular statistics, the seasonality of the annual maxima flood series and strength of the seasonality was explored for all NRFA Peak Flow catchments and catchments of less than 40km². These results are presented on Figure 4 classified according to level of urbanisation (based on URBEXT_{2000}). The direction of the arrow denotes the seasonality and the length of the arrow depicts the strength of that seasonality.
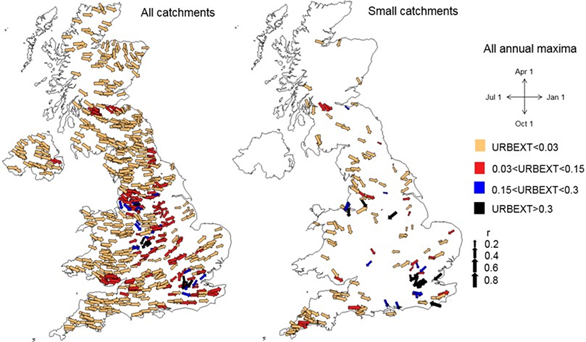
Figure 4. Flood seasonality maps for all the UK catchments (on the lefthand side) and for the small catchments (on the righthand side) categorised by urbanisation influence. It is based on all the flood annual maxima
Based on this analysis the following default rules were established for selecting when summer storms should be used in ReFH2:
Summer storms are selected by default if:
- URBEXT_{2000} is ≥ 0.30, or
- 0.15 ≤ URBEXT_{2000} < 0.30 and BFIHOST19 is ≥ 0.65.
Winter storms are selected by default in all other cases.
In ReFH2 the equivalent urban area parameter is used to set the default, so that the default season may be updated if the user amends the urban area or BFIHOST19 parameters. The user can override the default if there are local data available that would suggest that the actual flood seasonality deviates from the default.
The different UK regulators may have specific guidance relating to the choice of seasonality and Tp Factor - please ensure you use the appropriate settings.
Note that in the legacy ReFH2.2 model the default seasonality is always winter.
Urban Model Default Parameters
A default estimate of the urban area in a catchment is based on the URBEXT_{2000}. The default ratio of the urban area to the catchment area is estimated from URBEXT_{2000} using:
and thus the as-rural area in the catchment is given by:
The urban area is broadly equivalent to the urban extents mapped on the Ordnance Survey 1:50,000 maps. Mapping information can be used to refine this estimate as required. The four model parameters in the urban model are as follows in Table 2.
Table 2. Urban model parameters in ReFH2.3 and ReFH2.2 Models
| Parameter | Units | ReFH2.3 Default Value¹ | ReFH2.2 Default Value¹ |
|---|---|---|---|
| IF – the impervious factor | Dimensionless | 0.4 | 0.3 |
| IRF – the impervious runoff factor (or the fraction of the impervious surface that is positively drained) | Dimensionless | 0.7 | 0.7 |
| DS – the depression storage (expressed as a depth) | mm | 0.5² | 0.5² |
| Tp Factor – the factor that is applied to the as-rural time to peak parameter to reflect the influence of positive drainage on catchment response. | Dimensionless | 0.75 | 0.5 |
¹ The difference between IF and Tp Factor default values in ReFH2.3 and ReFH2.2 are discussed further in ReFH2 Science Report: Closing a Water Balance^{R2}.
² A review of depression storage and the rationale for selecting a default of 0.5mm for DS is presented in ReFH2 Science Report: Closing a Water Balance^{R2}.
Kjeldsen et al (2013) considered modelling results from small heavily urbanised catchments using observed but relatively small magnitude storm events. The paper identified Tp multipliers in the region of 0.25 to be used in conjunction with values of IF and IRF fixed at values of 0.3 and 0.7 respectively.
To define default values for the non-water balance design package this analysis was extended to consider the results obtained applying ReFH2 to catchments classed as suitable for QMED estimation and that are classed as being heavily urbanised or greater (URBEXT_{2000}≥ 0.15). ReFH2 was applied treating the catchments as-rural catchments. The model was then applied treating the catchment as urbanised and invoking the storm seasonality rules. The IF and the Tp Factor parameters were optimised to minimise the bias towards under-estimation observed in the “as rural applications” of the model with IRF held at the default value of 0.7. This work is presented in detail in Small Catchments Project Phase 2 Report 6 and concluded that for the original urbanisation model that a value of IF=0.3 and Tp Factor of 0.5 were appropriate.
This work was revisited for the water balance design package configuration of the model and this analysis suggested that the IF and Tp Factor values should be updated to 0.4 and 0.75 respectively. This is discussed further in ReFH2 Science Report: Closing a Water Balance^{R2}.
The different UK regulators may have specific guidance relating to the choice of seasonality and Tp Factor - please ensure you use the appropriate settings.
Use of Local Data
Using map data to update estimate of urban area, IF and IRF
The urbanisation framework is very flexible and the default parameterisations should be regarded as a starting point. The ReFH2 software presents the default estimated urban area as a user editable field. So, using one, or a combination of maps, satellite imagery, site walkovers and surveys there is the opportunity to update this generalised estimate to reflect the “on the ground” urban area. Similarly, the appropriateness of the default Impervious Factor can be evaluated using similar sources and updated as required.
Before expending significant effort on sourcing revised estimates, it is strongly recommended that a sensitivity analysis is undertaken to determine how sensitive the model outcomes are to changes in these parameter values.
If the IRF is interpreted as the fraction of the impervious surface that is positively drained it can be updated through consideration of the fraction of the impervious area drained by surface and combined sewer drainage systems. Again, as this involves significant effort any such updating should be preceded by a sensitivity analysis.
The ReFH2 estimates are not sensitive to depression storage depth as this is a small fraction of the incident precipitation for events resulting in significant floods.
Using level or flow data to revise Tp and Tp Factor
If there are level or flow measurements in the catchment an analysis of hydrograph shapes and rainfall lags provide a means for updating Tp. Although more complicated than the as-rural case, if data is available there may be scope to update both Tp and the Tp Factor. Use of information on lags is considered in more detail in the Environment Agency’s Flood Estimation Guidelines.
Modelling the influence of sewer catchments on the urban flood hydrograph
Within a catchment, combined sewers and surface water drains provide the potential to export runoff to either adjacent catchments or to a point in the catchment downstream of the point of interest.
ReFH2 allows the user to specify both a sewer flow capacity (m³/s) and the Exporting Drained Area (km²). This area cannot be greater than the urban area. Drainage may either be exported into adjacent catchments (this can commonly occur in combined sewer systems) or the drainage system may be discharged to the watercourse downstream of the point of estimation. The setting of Exporting Drained Area requires a detailed knowledge of the drainage systems.
ReFH2 will divert the nett rainfall generated from the specified urban area to the exporting sewer up to the specified sewer capacity, thus removing this runoff from the simulation of the event hydrograph. Urban runoff in excess of this flow rate is retained within the catchment.
The capacity of the sewer system in an urban area can be estimated as the rainfall event which it is able to convey without significant overflows. Typically, older sewer systems are able to convey the 1 in 10 year rainfall event and newer systems the 1 in 30 year rainfall event.
It is common industry practice to use the 1:10 year event rainfall intensities to set these capacities. To simulate this in ReFH2, the user will need to go back to the Rainfall Screen and select the 1:10 or 1:30 year rainfall event. You will see that the total rainfall depth is displayed above the hyetograph. Note down this total rainfall (Rainfall_{TOTAL}) and the duration of the event. The capacity of the sewer in flow units can be estimated from the total 1:10 year rainfall depth as:
where Exporting Drained Area (km²) is the urban area within the catchment that is served by exporting sewers/drains, Rainfall_{TOTAL} (mm) is the total rainfall depth associated with the rainfall event setting the sewer capacity and Duration (hours) is the duration of the rainfall event, thus setting the sewer capacity. The calculated sewer capacity is in flow units (m³/s). Note that if the Exporting Drained Area changes the sewer capacity will need to be recalculated.
It is important that the drainage systems for which intercepted nett rainfall is retained within the catchment (those that collect and discharge within the catchment) are not modelled using this functionality as the influence of these is modelled using the Tp Factor.